Create animations of your design process
Source:vignettes/camcorder_record.Rmd
camcorder_record.RmdThe main purpose of camcorder is the recording of all steps involved in a data visualization design with the ultimate goal to generate an animated gif file of all steps. (For more on the pretty cool side effects for your workflow thanks to camcorder look here).
Start a Recording with gg_record()
We initialize a recording with the gg_record() function.
After running the following code, camcorder is saving
a file with the given specifications in the given directory every time
ggplot() is called.
library(camcorder)

gg_record(
  dir = file.path(tempdir(), "recording"),
  device = "png", # we need to set the Cairo device
  width = 8,
  height = 5
)
Note: If you want to keep your plot files afterwards, set the
dir in gg_record to a permanent directory
(instead of a temporary directory as in our examples).
Now we can start building our plot:
ggplot(diamonds, aes(x = carat, y = price)) +
  geom_point()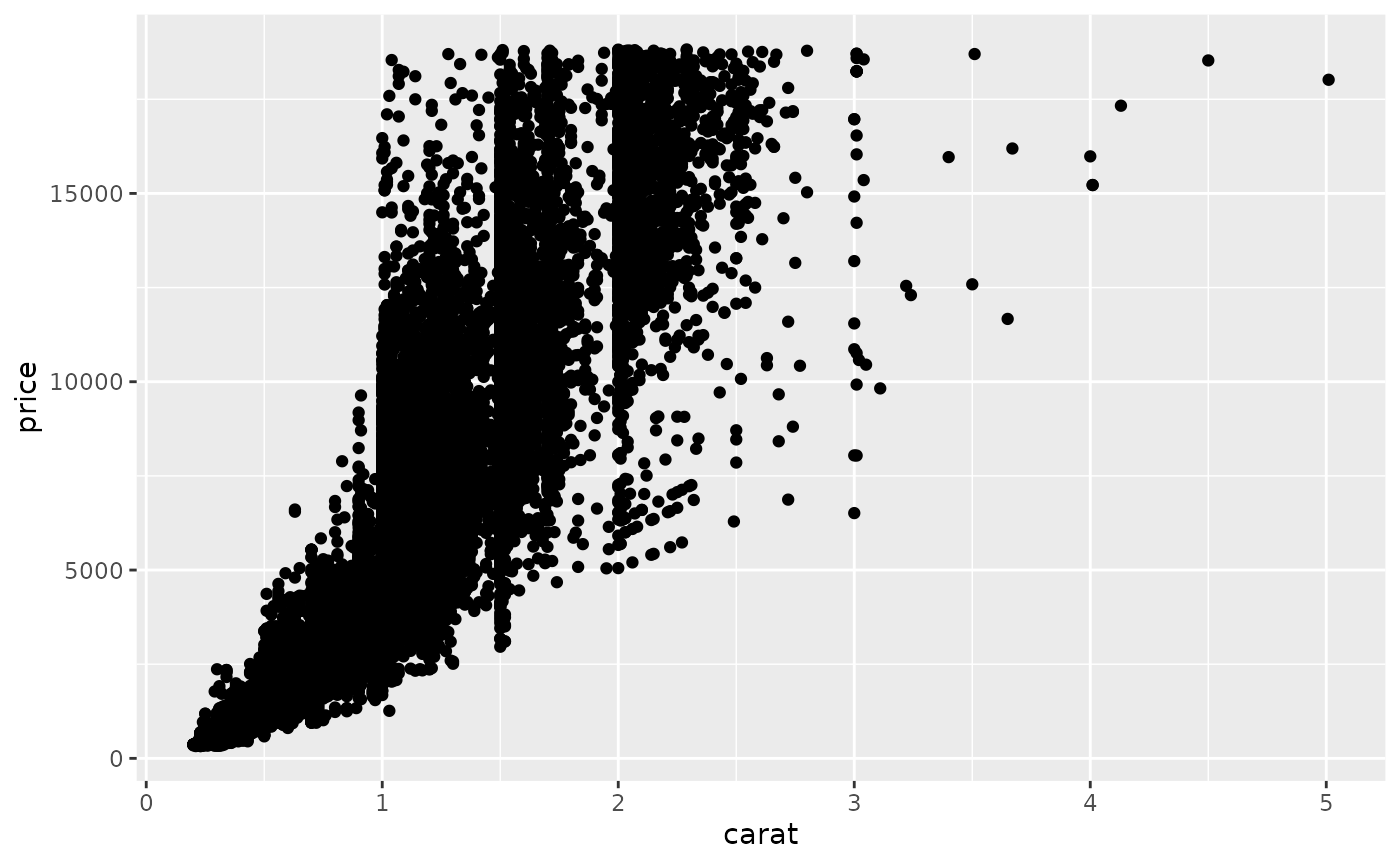
ggplot(diamonds, aes(x = carat, y = price)) +
  geom_point(alpha = .2)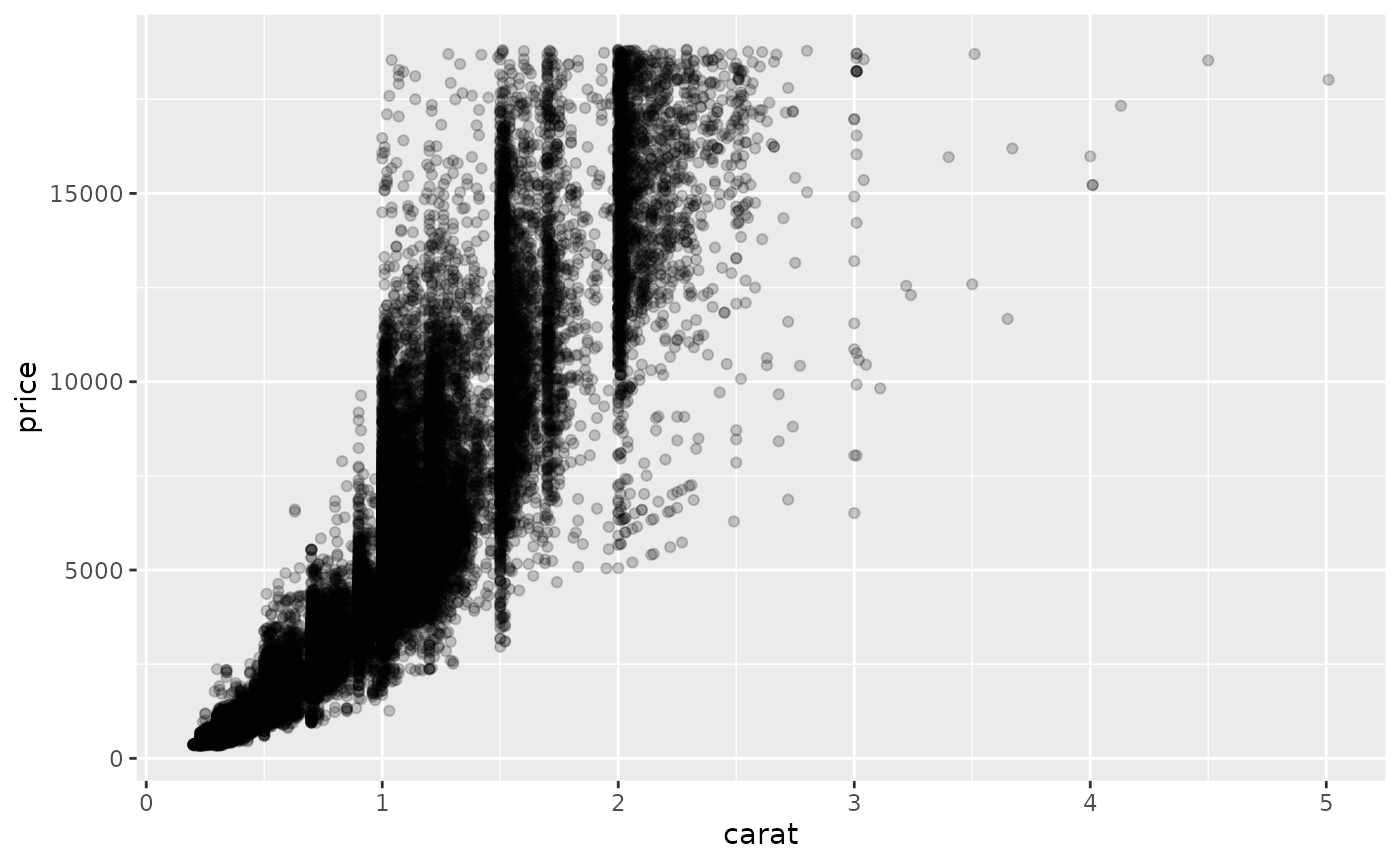
ggplot(diamonds, aes(x = carat, y = price)) +
  geom_bin2d()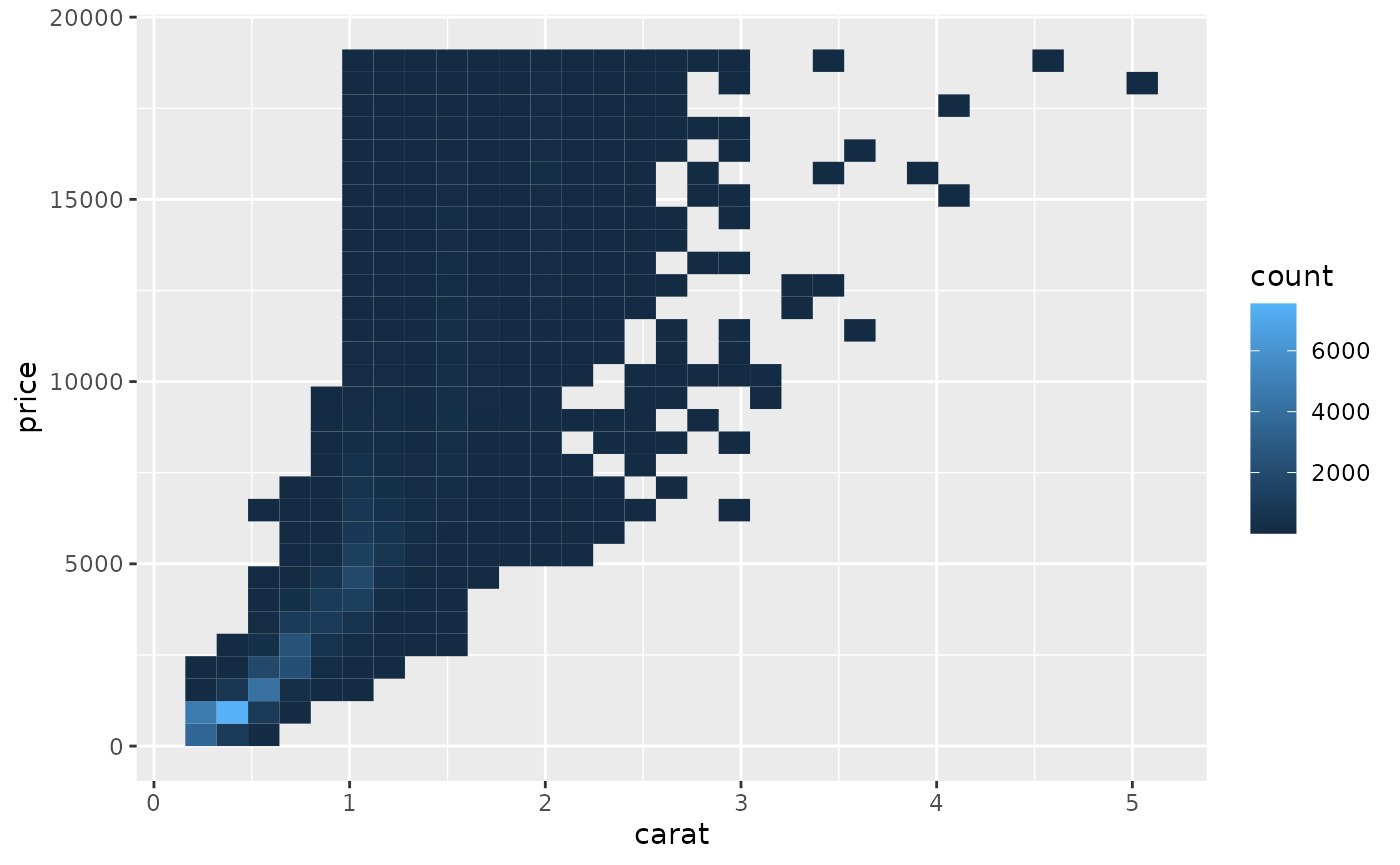

ggplot(diamonds, aes(x = carat, y = price)) +
geom_hex() +
scale_fill_viridis_c(option = "magma")
ggplot(diamonds, aes(x = carat, y = price)) +
  geom_hex() +
  scale_fill_viridis_c(option = "magma", direction = -1)
ggplot(diamonds, aes(x = carat, y = price)) +
  geom_hex() +
  scale_fill_viridis_b(option = "magma", direction = -1)
ggplot(diamonds, aes(x = carat, y = price)) +
  geom_hex(color = "white") +
  scale_fill_viridis_b(option = "magma", direction = -1)
ggplot(diamonds, aes(x = carat, y = price)) +
  geom_hex(color = "white") +
  scale_fill_viridis_b(option = "magma", direction = -1) +
  theme_minimal()
ggplot(diamonds, aes(x = carat, y = price)) +
  geom_hex(color = "white") +
  scale_fill_viridis_b(option = "magma", direction = -1) +
  theme_minimal() +
  theme(panel.grid.minor = element_blank())
ggplot(diamonds, aes(x = carat, y = price)) +
  geom_hex(color = "white") +
  coord_cartesian(clip = "off") +
  scale_y_continuous(labels = scales::dollar_format()) +
  scale_fill_viridis_b(option = "magma", direction = -1) +
  theme_minimal() +
  theme(panel.grid.minor = element_blank()) +
  labs(x = "Carat", y = NULL, fill = "Number of diamonds")
ggplot(diamonds, aes(x = carat, y = price)) +
  geom_hex(color = "white") +
  coord_cartesian(clip = "off") +
  scale_y_continuous(labels = scales::dollar_format()) +
  scale_fill_viridis_b(option = "magma", direction = -1) +
  theme_minimal() +
  theme(
    panel.grid.minor = element_blank(),
    legend.position = "top"
  ) +
  labs(x = "Carat", y = NULL, fill = "Number of diamonds")
g <-
  ggplot(diamonds, aes(x = carat, y = price)) +
  geom_hex(color = "white") +
  coord_cartesian(clip = "off") +
  scale_y_continuous(labels = scales::dollar_format()) +
  scale_fill_viridis_b(
    option = "magma", direction = -1,
    guide = guide_colorsteps(
      title.position = "top", show.limits = TRUE,
      barwidth = unit(16, "lines"), barheight = unit(.8, "lines")
    )
  ) +
  theme_minimal() +
  theme(
    panel.grid.minor = element_blank(),
    legend.position = "top"
  ) +
  labs(x = "Carat", y = NULL, fill = "Number of diamonds")

g
Resize Plots with gg_resize_film()
The hex grid looks a bit off, so let’s change the aspect ratio as a
final step by calling the gg_resize_film() function:
gg_resize_film(
  height = 5,
  width = 5,
  units = "in",
  dpi = 600
)
g
Create a GIF with gg_playback()
Once we are happy with the visualization, we can create an animation using all the automatically saved plots:
gg_playback(
  name = file.path(tempdir(), "recording", "diamonds.gif"),
  first_image_duration = 4,
  last_image_duration = 12,
  frame_duration = .5,
  image_resize = 900,
  width = 800,
  height = 800
)
Once rendering is complete, a gif is saved and then opened in your viewer.
End a Recording with gg_stop_recording()
If you ever wish to stop the automatic saving, just
rungg_stop_recording().